Home
About Us
Headteacher's Welcome
Meet The Team
Our Values
Mission Statement
Penns House System
Friends of Penns
Governors
Staff Well-Being
Community
Job Vacancies
Statutory Information
Safeguarding
Attendance
School Policies
Behaviour
SEND Information Report and Local Offer
Pupil Premium
Sports Premium
EAL Support
Equality Statement
OFSTED
Parents
Term Dates
GDPR
Admission Criteria
Lunch Menus
Uniform
Performance Data
Home and School Agreement
Honeybears
Class Representatives
Music lessons
Volunteers
Diversity
New Reception Starters
Free 11+ preparation and KS2 learning
Curriculum
Curriculum Subjects
Curriculum Overviews
EYFS
Subject Leader Profiles
Pastoral
Relationship and Sex Education
Online Safety
Pupil Well-Being
Homework
Extra Curricular Clubs
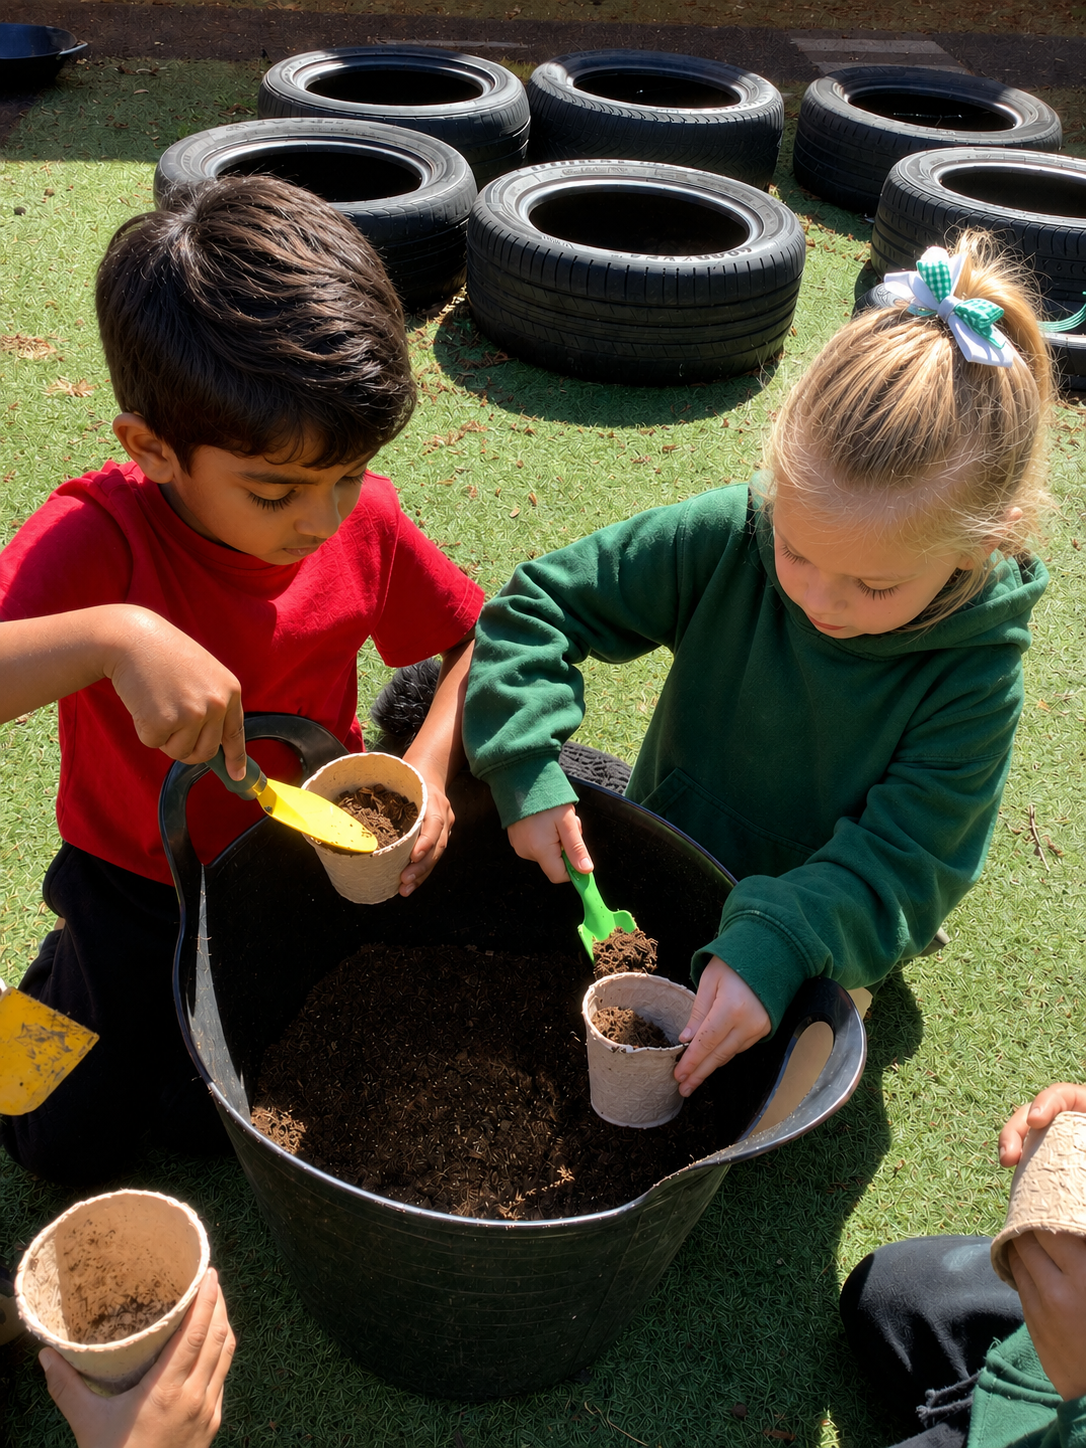
Outdoor Learning
INCLUSION
Pupils
MENU
Home
About Us
Headteacher's Welcome
Meet The Team
Our Values
Mission Statement
Penns House System
Friends of Penns
Governors
Staff Well-Being
Community
Job Vacancies
Statutory Information
Safeguarding
Attendance
School Policies
Behaviour
SEND Information Report and Local Offer
Pupil Premium
Sports Premium
EAL Support
Equality Statement
OFSTED
Parents
Term Dates
GDPR
Admission Criteria
Lunch Menus
Uniform
Performance Data
Home and School Agreement
Honeybears
Class Representatives
Music lessons
Volunteers
Diversity
New Reception Starters
Free 11+ preparation and KS2 learning
Curriculum
Curriculum Subjects
Curriculum Overviews
EYFS
Subject Leader Profiles
Pastoral
Relationship and Sex Education
Online Safety
Pupil Well-Being
Homework
Extra Curricular Clubs
Outdoor Learning
INCLUSION
Pupils
Penns Primary School
Welcome to
Penns Primary School
KS2 PERFORMANCE DATA
Read
Write
Maths
GPS
KS2 (2023)
87%
80%
87%
90%
KS2 (2024)
93%
90%
100%
93%
KS2 (2025)
93%
93%
93%
90%
Penns Performance Data
Term Dates
GDPR
Admission Criteria
Lunch Menus
Uniform
Performance Data
Home and School Agreement
Honeybears
Class Representatives
Music lessons
Volunteers
Diversity
New Reception Starters
Free 11+ preparation and KS2 learning
Our Water Cooler is from AquAid Here at Penns Primary we installed a water cooler from aquaid. In doing so, we have become the proud sponsors of an Elephant pump in Africa.